Profiling DataWarehouse API performance (time, query and memory)
How to profile and optimize slow and resource-intensive endpoints
Problem
An endpoint started failing and alerts point to:
- Status Code 500 (Internal Server Error) or 502 (Bad Gateway)
- uWSGI logs showing “killed by signal 9”
- Cluster logs showing Out-of-Memory (OOM) Killer (
node_vmstat_oom_killavailable via node-exporter on OpenShift web console)
Check for server being killed
You can look for the killed by signal 9 message in uWSGI logs using Grafana.
Select the data source called Loki, define your time range and use the following query:
{
   deployment="datawarehouse-webservice",
   logname=~"app-uwsgi.*",
   cluster="mpp_prod_external"
} |= `killed by signal 9`
Solution
Reproduce the request in your development environment and watch resources using Django Debug Toolbar.
How to use Django Debug Toolbar in DataWarehouse
- To enable the toolbar add “debug=1” to the URL. Any truthy value should work.
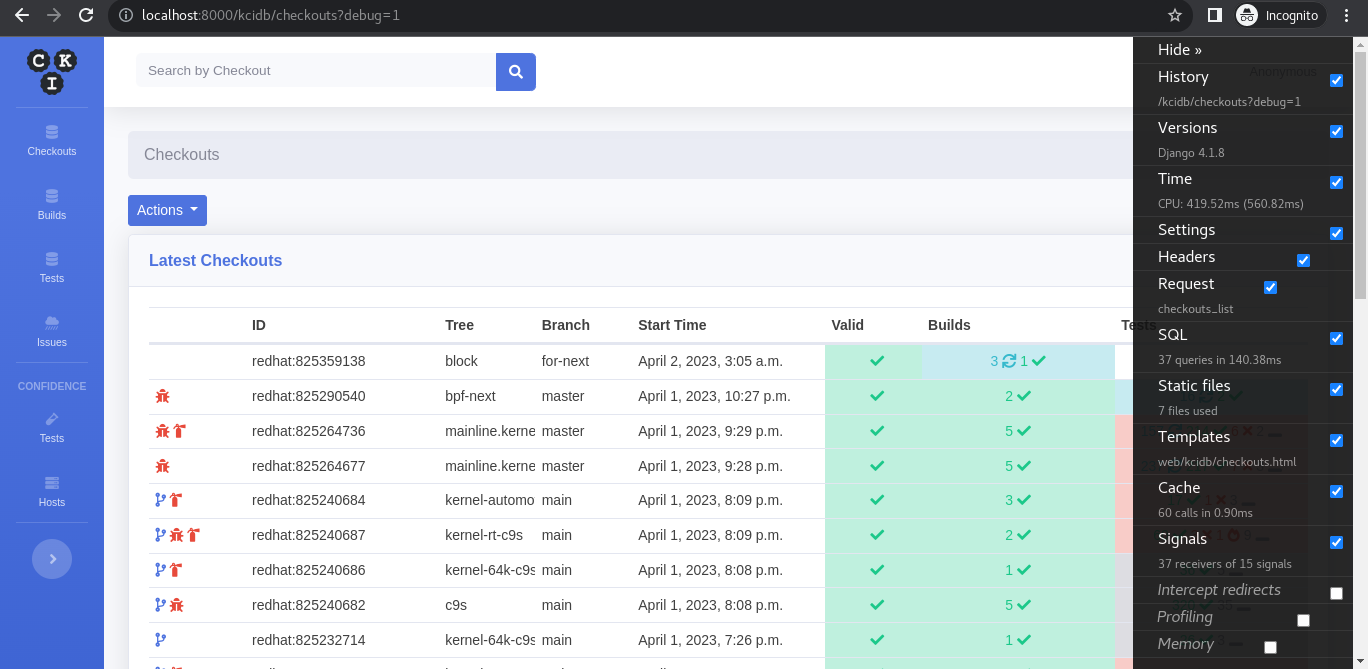
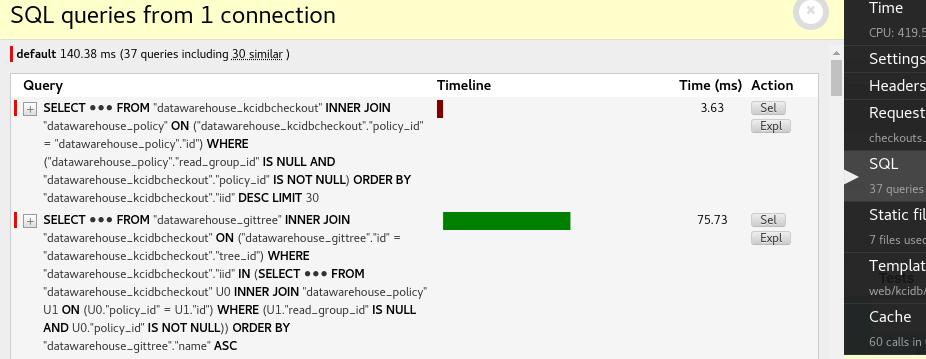
- In the toolbar, you can see all the queries executed while fetching the URL in the “SQL” tab.
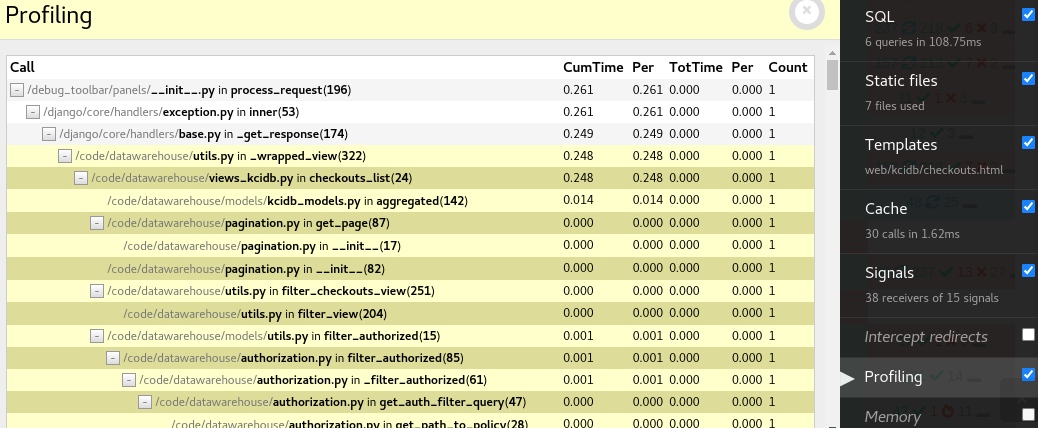
- In the “Profiling” tab you can also see how many times each function was called and how much time they took to run. It comes disabled by default, so make sure to toggle the checkbox to be able to use it.
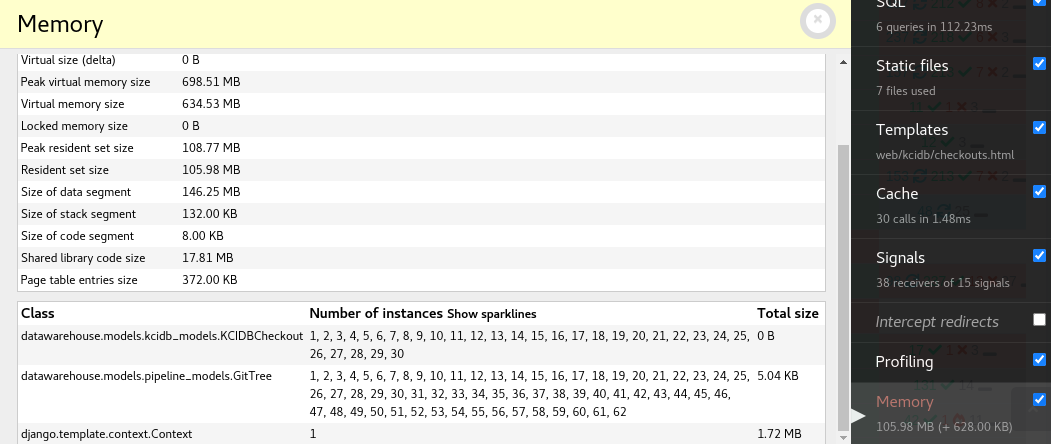
- Finally, the “Memory” tab contains some information about the objects instantiation, which probably would have caused the OOM problems. Depending on the scenario, garbage collection might cause reports to be generated with size set to zero, otherwise with GBs of allocated memory, but nonetheless it can help debugging. The backend of this panel is provided by a third-party dependency called pympler.
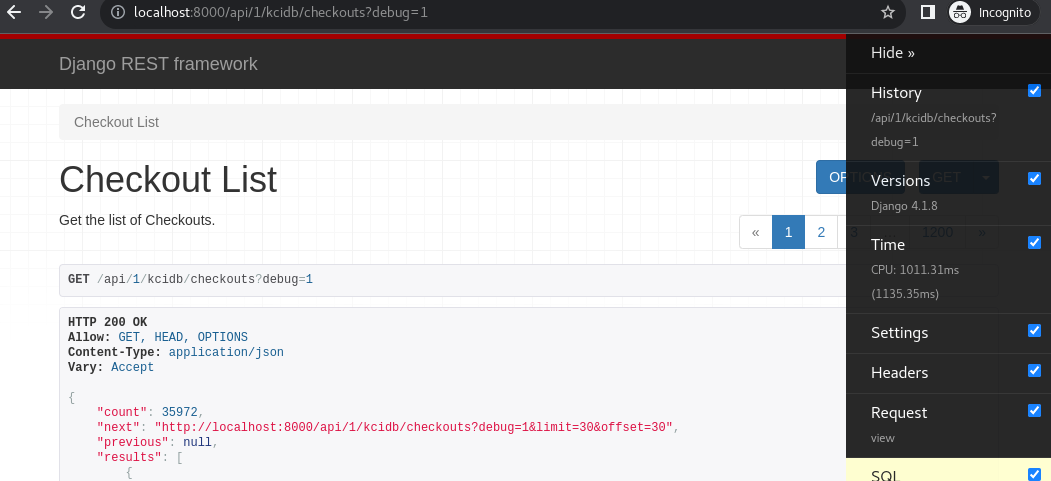
- API endpoints can also be profiled using the toolbar over the browsable-api. With GET requests you just need to include “debug=1”, like before.
- Other requests, like POST, PUT and PATCH require an additional step. Submit the request using the browsable-api, you should be automatically redirected to the response view. Go back to the GET view using the “debug=1” param, then open the “History” tab. Inside the tab you will see your previous request; click “switch”. Now the toolbar should show stats for your previous request, where you have submitted something.